Google

Thursday, January 31, 2008

The One-Pip Range Trading Strategy

This is the Range Trading Strategy discussed in my previous blog:

One-PIP Range Trading Strategy:
1. Look for a Ranging Pair for 1 min Chart
2. Limit Buy or Limit Sell at the inner edge of Bollinger bands.
3. Where possible enter position in direction of Long Term trend, eg short at upper Bollinger band where Long Term is bearish, and long at lower Bollinger band where Long Term is bullish. Long Term could be 1 hour or 1 day chart.
4. Alternatively, if Long Term is also Ranging, eg, if the hourly chart is ranging, then enter position in the direction of the expected price swing. But if it conflicts with the daily chart, give preference to the daily chart. (For this discussion, we assume the daily chart and the hourly chart are in agreement. ) In the hourly chart the price is at upper edge of Bollinger band, then in the 1 min chart, enter a short at the upper Bollinger band as well.
5. Set TP as close as possible to opening price, eg, 1 pip
6. Let SL be Oanda's default which is usually around 10-20 pips
7. Enter 1000 units (instead of the usual 200 or 500) to make the 1 pip give better yield.
8. Ensure that the currency pair is highly volatile and liquid


I shall now illustrate item number 4 above (highlighted in red) with CHF-JPY.

We first look at the daily chart:


The daily chart above shows that the price is at the upper end of the Bollinger band. This means that it should reverse soon and start going down. Therefore, we should not open a long position. Instead any position we open should be a short position.

Next, we look at the hourly chart:


The hourly chart above shows that the price is on the way down. This indicates that the price is still in the upper band of the Bollinger band. As such there is still some posibility that the price will still go down - in order to reach the lower edge of the Bollinger band. This means that we should not open any long positions. Any positions we open should be a short position. Howerver, do note that if there is a conflict between the Daily Chart and the Hourly Chart, you should follow the Daily Chart. Eg, if the daily chart indicates that the price is at upper edge of Bollinger band and is about to swing down, do open a short position. If the Hourly chart shows the price is at bottom of Bollinger band, the Daily chart should be given preference, because it indicates price behaviour in the Long Term.

And finally we come to the 1-minute chart:


You will note that I have inserted a Limit Sell (short position) on the upper edge of the Bollinger Band. I should never put a Limit Buy (long position) because, we have seen that the daily chart as well as the hourly chart indicates the price is going down.

CHF-JPY Range Trade - Bollinger Band

WON: 1 pip (First Trade)
WON: 1 pip (2nd Trade)
WON: 1 pip (3rd Trade)
WON: 1 pip (4th Trade)


I'm back to Range Trading with Bollinger Bands again.
I've mentioned this new Strategy before, but here it is again:

One-PIP Range Trading Strategy:
1. Look for a Ranging Pair for 1 min Chart
2. Limit Buy or Limit Sell at the inner edge of Bollinger bands.
3. Where possible enter position in direction of Long Term trend, eg short at upper Bollinger band where Long Term is bearish, and long at lower Bollinger band where Long Term is bullish. Long Term could be 1 hour or 1 day chart.
4. Alternatively, if Long Term is also Ranging, eg, if the 1 hour chart is ranging, then enter position in the direction of the expected price swing. For example, if hourly chart the price is at upper edge of Bollinger band, then in the 1 min chart, enter a short at the upper Bollinger band as well.
5. Set TP as close as possible to opening price, eg, 1 pip
6. Let SL be Oanda's default which is usually around 10-20 pips
7. Enter 1000 units (instead of the usual 200 or 500) to make the 1 pip give better yield.
8. Ensure that the currency pair is highly volatile and liquid


I applied this strategy to CHF-JPY.

SL=15 pips TP=1


So far so good, I've won 4 times since yesterday, using this strategy. Let's see if it will continue to work.

I entered a second trade with the same currency with the same setup and harvested another 1 pip - 5th win using this setup.

Again, I entered a third setup and again 1 won 1 pip - the 6th win with this setup.

CHY-JPY seems to be very liquid and volatile - time now around 6 pm.

And again - entered another short and won 1 more pip

Total 4 pips within the hour. I' take a break now and continue tonight.

EUR-USD Trend Trading with MACD

WON: 13 pips

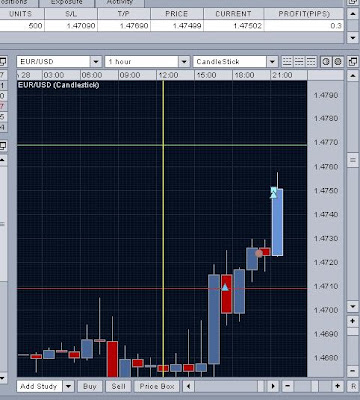
4 hours after the Feds announced another interest rate cut on the USD, I entered a 500 units long position on EUR-USD, based on the signal line crossing the MACD in the upward direction with the MACD histogram indicating a strong upward momentum.

SL=23 pips TP=13 pips


After 8 hours, the price hit the TP and i won 13 pips. However, it took 8 hours - strange.
I had expected the EUR-USD pair to rise sharply and steadily. Up to time of writing, it appears the Feds' interest rate cut has very little effect on the EUR-USD pair. There was an initial sharp rise (see the blue long bar above). After that, it was ranging sideways. I opened a long position indicated by the blue triangle.

CAD-JPY Range Trading using Bollinger Bands

WON: 1 pip


Won: 1 pip
New Strategy:
1. Look for a Ranging Pair for 1 min Chart
2. Limit Buy or Limit Sell at the edge of Bollinger band.
3. Set TP as close as possible to opening price
4. Let SL be Oanda's default which is usually around 10-20 pips

The profit is only 1 pip, but if you did it 10 times, you get 10 pips. The last 3 trades were all done within the hour harvesting 3 pips profits.

It's 12.28 am. Yawn.... Going to bed.

EUR-AUD Range Trade Using Bollinger Bands

WON: 1 pip

Wednesday, January 30, 2008

CHY-JPY Range Trading Using Bollinger Band

WON: 1 pip

EUR-CHF Trading the Daily Chart - without Forex Killer

WON: 1 pip

I have had enough losses using Forex Killer 1 and 2 and have lost all confidence in them. In all the previous trades using them, I only won 1 trade and lost all the other 4.

From now on, I think I will stick to Bollinger Band for Range Trading and MACD for Trend Trading - the two classical tools for Range and Trend Trading respectively. My strategy is also to trade the Daily Charts - since this chart is indicative of Long Term price direction.

Below is my first experiment with Daily Charts, trading the EUR-CHF pair:


SL = 27 pips TP= 24 pips (Oanda's default)

Decision to open long trade on EUR-CHF is based on:

1. MACD trigger line crossing MACD in upward direction
2. MACD Histogram indicates strong upward momentum

Only 200 units - just to see what happens. Will MACD work better on Daily Charts? So far MACD has not been reliable on short term charts: M1,M5,M15,M30.

I avoid the USD currency for today because I do not know how the second US interest rate cuts (due to be announced today - Jan 30), will impact the USD.

Re-adjusted my SL=50 pips and TP=100 pips

Throughout the whole day the price moved down and up and stayed at around the same price. Looking at the 1 minute chart, I saw many range bound trades - which I had missed out on. Realizing this, I immediately closed the position with a 1 pip profit. It was evident the price was going nowhere.

Tuesday, January 29, 2008

EUR_CAD using Forex Killer 1

LOST: -40 pips


Short EUR-CAD, SL=40 pips, TP=20 pips :


After 3 hours, the price rose and took out my Stop Loss. I lost 40 pips.
Forex Killer has failed yet again. I am beginning to lose confidence in Forex Killer.

CAD-JPY using Forex Killer Version 1

LOST: -40 pips


500 Units Long SL=40 TP=80 :


The price went up a few pips then rapidly dropped and took out my Stop Loss.
I lost 40 pips. Forex Killer has failed.

In retrospect, this might have worked: SL=40 TP=10
Most of the price will move up 10 pips quite easily but to reach beyond that is very difficult.


Forex Killer version 1 is better than version 2?

Input the 10 previous price on the hourly chart of GBP-USD, I get two different signals, depending on which version of Forex Killer. Below is version 2, which gives a Sell signal, with probability of 62%:

What is perplexing is why does it give a SELL signal when the graph clearly shows a long-term uptrending? It is only in the last price that is going down. How can this justify a SELL signal at 62%?

Next, I repeated the exercise using version 1. And this is what I got:


Notice that it is much easier to input price values in version 1. Firstly, I can just type 4 digits (and 3 digits in the case of JPY). I don't have to type in 1.9841, it is sufficient to just type in 9841. When I did this in version 2, I get a strange flatline. Secondly, in version 1, after entering a price, and pressing Enter, the input box clears by itself and I can enter the next price. But in version 2, I had to use to the mouse to use the mouse to click in the text box first, after each Enter key - this slows input down quite a lot. But the most starling thing is it gives a NO TRADE signal even though the Sell probability is 69%.

However, version 2 has the added Long Term Signal analysis which says NO TRADE. That alone could indicate a No Trade, if we only wish to enter a trade when both ST and LT agrees.

A possible trading strategy, which is highly conservative would be as follows:

SELL when both ST and LT indicates a Sell Signal AND,
the probability for the ST is 70% or above (as is the case with version 1).

BUY when both ST and LT indicates a Buy Signal AND,
the probability for the ST is 70% or above (as is the case with version 1).

Having said that, I still have a nagging feeling that Version 1 is a better signal indicator - for the reasons discussed above.

USD-CAD using ST and LT Signals

LOST: -24 pips

Strategy: When Both ST and LT Signals say the same thing, enter the trade:


Entered a Long Position for 1000 units for USD-CAD pair, SL=19 pips, TP=16 pips at 11:30 am.


Let's see if Forex Killer v.2 is any good.

After 4 hours, I was stopped out for -24 pips. Looks like Forex Killer v 2 was totally wrong about this trade despite it's ST and LT signals.

First Trade for Today GBP-USD

LOST: - 3 pips

Forex Killer Sell Signal generated on GBP-USD pair at 10:20 am:


Notice I'm using Forex Killer v 2.14. Yesterday, I was using v 1.0. Also notice that a Sell Signal is generated even though the Sell Probability is only 55%. With v 1.0, you only get a Sell Signal is it is above 70%. I hope v 2.14 knows what it is doing.

I entered a short position for 1000 units on GBP-USD for 1.9821, SL=34 pips, TP=30 pips


I then did a Long Term Signal Analysis and came up with a No Trade Signal:


Notice that the Short Term Signal ("ST Signal") indicates SELL, but, the Long Term Signal ("LT Signal") indicates No Trade. I immediately closed my open position with a loss of only 3 pips. In all my next experiments, to make the trade prediction stronger, I will only enter into a position if BOTH the Short Tem Signal and the Long Term Signal indicate the same signal.

Monday, January 28, 2008

Second EUR-USD Trade today using Forex Killer

WON = 30 pips
LOST = -9 pips

Again, I got another buy signal on Forex Killer:


I entered a long position with SL = 40 pips and TP = 20 pips at 9.15 pm :


After 1 hour, the price went up 12 pips and I re-adjusted my TP to 80 pips.
In the next hour, the price went up 30 pips from my entry price. It then started to go down. I immediately adjusted my SL 10 pips above my entry price to lock in 10 pips profit. Note that Oanda Trading Platform has no Trailing Stops.

When the price rose 45 pips, I entered another long position of 500 units at 1.4794 SL = -40 pips TP=80 pips

I now have 1000 units opened.

In the next hour, the price begin to drop 7 pips. I increased my SL = 20 pips above the entry price for the first long position. This locks in 20 pip profits. The next hour in increased SL = 30 pips to lock in 30 pips profit and also closed my 2nd trade with a loss of 9 pips. I now have only 1 open position with SL=30 pips above entry price and TP=80 above entry price

After 2 hours, the price dropped and I was stopped out, winning 30 pips.

Forex Trading Using Forex Killer on EUR-USD

WON: 12 Pips

Got buy signal:

Entered long at5.20 pm. SL = 40 pips, TP = 22 pips


The price went about 15 pips then reverse down, whereupon, I closed the position and
Won 12 pips:


This time Forex Killer was correct in its prediction.

Forex Trading using Forex Killer on USD-JPY

LOST: 40 pips

In the previous trading, the price took out my adjusted Stop Loss. I re-ran Forex Killer again and this time it gave a 92% sell signal for the H1 chart:


And so, I shorted the USD-JYP again at 106.15 at 3.15 pm:


I then adjusted the SL to 40 pips, i.e at 106.55 and left the TP for 16 pips at 105.99.
Ater about 15 minutes, the price rose 40 pips and took out my Stop Loss. I had lost 40 pips.
Forex Killer seems to be wrong on this trade.

Forex Trading Using Forex Killer

Experimenting with Forex Killer.

Based on this:
Note that I used only 3 digits. For example, instead of typing in 106.67, I just typed in 667.
For JYP, one pip is .01, so Forex Killer should still work.

I shorted the USD-JPY at 106.19 at 1.08 pm. Below is the screenshot after 1 hour:


I had moved my Stop Loss from 40 pips to the Actual Sell Price itself. And I moved the Take Profit 60 away. Hopefully the profits will keep running. ForexKiller has been correct so far.

Unfortunately after about 5 minutes, the price went up and took out my Stop Loss and I made 0 pips profit. It appears that I have tried to lock in the profits too soon.

Saturday, January 26, 2008

Forex Range Trading inevitably involves Trend Trading

Here are my observations to date:

When trading Range Trading, I am looking at a short term period, usually 1 min to 15 mins charts.
Should I then, short at the top of Bollinger band or long at the bottom of Bollinger band?

To answer this, I should take a look at the larger period charts, eg, 1 hour or 1 day- to find the larger trend. If the hourly (or daily) chart shows a bullish trend, then, I should enter long at the bottom of the Bollinger band - NEVER short at the top of Bollinger band. Why?

Because there is an inertia for the price to go up. If the price were to break from the range channel, there is a tendency for it to go up.


The reverse is also true. Let's take a reverse scenario. Let's assume the price is now ranging when I look at the 15 min charts. Should I short at the top of Bollinger Band, or, long at the bottom of Bollinger band? To answer this, I would look at the hourly (or daily) chart. If I find that the hourly (or daily) chart indicates a bearish trend. Then, I would short at the top of the Bollinger band - NEVER long at the bottom of the Bollinger band. Why?

Because there is an inertia for the price to go down. If the price were to break out of the range, there is a high probability it will go down.

What about Stop Losses, where should I put them?

First determine how much USD you are willing to risk, if you are willing to risk USD10, then convert it to pips, eg, 100 pips, and put your stop 100 pips below your long position, or, conversely 100 pips above your short positions.

Also, always enter a position when it is ranging - never when it is trending. By the time you spot a strong trend, it is usually too late to join the trend - this is because, you will never be able to spot a trend and join early. A trend, by definition, is a trend when there is already a clearly upward price movement or vice versa - by then, the trend is at risk of exhaustion. Instead, wait for it to consolidate (range), then enter a position in the direction of the trend as described in the above paragraphs.

In, Oanda Trading Platform, to convert price to pips. Look at the Account Summary Window on the left. Take the Unrealized P & L value and divide that with the value shown in the Profit Pips box on the top right. That will give you the price/pip. Then assuming you are willing to risk USD10 for Stop Loss, take 10/(price/pip).

I have also found MACD and Momentum Histogram to be unrealiable. Even though the trigger cuts the MACD and indicates a signal - the same trigger can almost immediate cut the MACD line again in the opposite direction! Be careful. The MACD histogram is equally unreliable. Even though the histogram may show a momentum exhaustion - indicating a price reversal, yet, int he next instant the momentum histogram may quite unexpectedly pick up again! Be forewarned.

Also, Stop Losses should never be tight. You should put large stop losses and trade very small units. Tight Stop Losses will knock you out probably 8 out of 10 trades! But in my experience, putting large Stop Losses will knock you out 2 out of 10 . Again be careful. That 2 out of 10 loss may be huge because of the large Stop Losses!

Other psychological observations:

1. Once a position is entered, don't bother to watch the monitor. Only check it at regular intervals. Impatience is the enemy. Watching a price going the wrong direction may cause you to close the position prematurely before it has a chance to turn around. Or, conversely, you may take profit too early and lose out on potentially larger earnings.

2. Never take revenge by entering an opposite direction once you lost a trade. By then the trend is almost always nearing exhaustion. Remember, the price has already travelled a long distance to hit your large Stop Loss.

Friday, January 18, 2008

Forex Range Trading CHF-JPY Pair


Using Bollinger Band. Selling at the top of the band and buying at the bottom of the Band.

Thursday, January 17, 2008

Large Stops and Waiting for Infinity....

Since I wrote my last observations about having large Stop Losses, I have experience the following:

1. If I trade very small units, I can set very large stop losses.
2. However, the profit that I will make is also very small (a few cents).
3. I might have to wait for days while the gap climbs to 10 pips, 20, 30, 40.... 100 pips and then,
ranges for eternity at 100 pips away, whilst I wait miserably with nothing to do.
4. It might be better to carefully select the currency pair that is ranging, and put tight stops.
If I'm wrong, I don't want to wait forever... I prefer to be stopped out early so that I can
use my capital to enter another position.
5. Alternatively, If I can't find a nicely ranging Currency Pair, I can trade Trend (instead of
Range). To trade trend, I would switch to MACD. When the trigger crosses the MACD
in the upward direction, I would buy (long position). When the trigger crosses the MACD
in the downward direction, I would sell (short position). I would put very tight stops. I also
want to be out early if I am wrong.

Friday, January 11, 2008

Successfully Range Trading USD-JPY Pair

Snapshot of a trading session using Oanda FxTrade Forex Trading Platform:


Selling at the top of the Bollinger Band and Buying at the Bottom of the Bollinger Band. A profitable range-trading strategy.