Lost: 350 pips
Trading with Stop Loss. I entered a Long Position via a Limit Buy at around 9.54 am.
The price kept falling and falling and at 10.45 pm, I experience my first Margin Call.
The price had dropped 350 pips in 12 hours. In terms of price, this is a 70% loss and is my biggest lost so far since I started trading in Dec 2007.
To me this is a most unexpected price behaviour for the EUR-JPY which is a ranging pair.
It appears that EUR-JPY's daily peak-to-peak amplitude is far wider than that of the CHF-JPY pair.
Unfazed, I took stock of my trading strategy again. Upon analysis, I find the CHF-JPY pair to have a smaller peak-to-peak daily amplitude and that is where I will focus on for my next trades. However, CHF-JPY seems to have a wider spread this week, today it is 5 pips. For the past 6 weeks it was 2.8 pips. This week seems to be a departure from the norm. However, the amplitude for the M1 chart seems to be about 20 pips as of writing. I figure that, so long as the bollinger band's width is much bigger than the spread, range trading is still possible. In this case, the spread is 5 pips, but the Bollinger Band is 20 pips.
I will still apply the same trading system, ie.
1-pip Range Trading Strategy without SL
Thursday, March 20, 2008
Wednesday, March 19, 2008
Stop Loss-less Trading
Having lost 157 pips in the previous trade, I took a long look at my trading history.
I discovered the following:
1. Almost all my losses since I started trading in December 2007 (last year) is caused by
Stop Losses. Only a handful is caused by my manually closing the trade (when the price was
going the wrong way).
2. In most cases, after the SL was taken out, the price would reverse direction and go the
right way.
3. None of my trades came close to margin calls, even after the SL was taken out.
4. Many of the SL was taken out by sudden price spikes (conversely, a few of the TP hits are
also caused by price spikes).
Based on the above observation, I hypothesise that, my losses are invariably caused by Stop Losses. This begs the question:
How to avoid losses?
And the only logical answer is:
Do not use Stop Losses.
I will now embark on a new revised One-Pip Range Trading Strategy. All of the strategy will
be the same, the only difference is:
Do not put in Stop Losses.
For this to work, I must be willing to accept the following:
1. I must be prepared to lose my entire capital. And I surmise that, I am prepared to do so. Whatever profit I want to keep, I will withdraw from the Oanda Account, and whatever is left in the Account is the amount I am willing to risk losing. That will be my psychological preparation.
2. I should not trade large amounts of units, not more than 1000 units.
With that, I henceforth trade SL-less.
Disaster strikes with EUR-JPY
Lost: 157 pips
My limit long order was fulfilled for 1000 units on the EUR-JPY pair at price 156.22 at 11 am.
My TP was 1 pip and SL = 156 pips.
At 5 pm, the price took out my SL. It had dropped 150 pips in 6 hours which translates to a 25% loss. This was totally unexpected. I had thought that my 150 pips SL would be sufficient.
But apparently I was wrong.
This taught me an important lesson: the SL for trading EUR-JPY should be more than 157 pips.
Maybe 200 pips would be more appropriate. And if, I was not willing to risk 200 pips SL, then, I should stay away from the EUR-JPY pair.
For CHF-JPY, a 100 pip SL was sufficient as evidenced by my 6 weeks' successful trades.
A good idea would be to do a study on intra-day fluctuations (daily peak-to-peak amplitudes) on the Ranging Pairs. This would help us decide the proper SL's to use on the respective pairs.
Tuesday, March 18, 2008
CHF-JPY unusually large spread 5 pips
CHF-JPY usually starts off on Monday with spread of 4 and by Tues it will drop to 2.8 right through to Friday. This has been its spread pattern for the last 6 weeks.
But for this week, I notice a change. It started off on Monday with spread of 4 pips, and by Tuesday, it increased to 5 pips. It appears to have broken its spread pattern.
Most of the time its Peak-to-peak amplitude was very wide around 10 to 20 pips and occassionally would compress to around 8 pips.
I noticed that the EUR-JPY is also ranging and its spread was only 2.7 pips.
So I switched to EUR-JPY.
Saturday, March 15, 2008
March 10 to March 14 : Won 45 pips Zero Losses
Won 45 Pips, No Losses
Second week of March won 45 pips. This is the 6th week in a row with zero losses.
Trading system has been successfully used throughout the 6 weeks beginning Feb first week.
Using this trading system:
One-Pip Range Trading Strategy
It is still too early to say with any certainty that this is a full-proof system however, judging from the success so far, I would attribute the success of this system to its purely mechanical trading characteristic.
Without any system, I would base my trading on emotion - eg, when I see a price go my direction, I increase the TP line instead of closing it after it has gathered a 1-pip profit. Also basing on emotion, if I see the price going the wrong way, I would close it quickly instead of allowing it to run all the way to my pre-determined SL line.
With a Trading System, after a position has been opened, I totally leave the screen alone - and refrain from looking at it. I just let my Forex Alerter system alert me once the TP or SL line is hit.
Monday, March 10, 2008
Wednesday, March 5, 2008
February earned 148 pips ( 30% profits )
For February, zero losses but won:
Feb 4 - 8 : 36 pips
Feb 11 - 15 : 47 pips
Feb 18 - 22 : 35 pips
Feb 25 - 29 : 30 pips
Average: 37 pips per week about 7 pips per day
Percentage earned: 30%
Using this trading system:
One Pip Range-Trading Strategy
and nothing else.
Feb 4 - 8 : 36 pips
Feb 11 - 15 : 47 pips
Feb 18 - 22 : 35 pips
Feb 25 - 29 : 30 pips
Average: 37 pips per week about 7 pips per day
Percentage earned: 30%
Using this trading system:
One Pip Range-Trading Strategy
and nothing else.
Monday, March 3, 2008
Feb 25 to 29 : Made 30 pips profits
WON: 30 pips
4th week in a row with zero losses. Amazing!
Also using the same trading system as the previous 3 weeks.
However the week ended with an unclosed Short Position which was left open throughout the weekend - because the price kept going up and the market came to a close on Saturday. I will lose some money on the carry trade interest since it is a short on the CHF-JPY. (CHF yields higher interest than JPY) However, I wasn't worried about it - the carry trade loss is minimal.
When market reopened today (Monday), the price dropped in the afternoon and hit my TP line and gave me a 1 pip profit after 2 days.
Last week saw a drop in the pips won compared to the previous week, because I was busy with another software Project (writing a Trojan binder & also successfully created a new trojan that can disable Eset Nod32 Antivirus) and had spent less time on trading.
Monday, February 25, 2008
Feb 18 to 22 - made 35 pips
WON: 35 pips
Using my One-Pip Range Trading Strategy + Forex Alerter I made 35 pips profit for last week.
No losses. Third week in a row with zero losses.
Let's see how this week fares.
Using my One-Pip Range Trading Strategy + Forex Alerter I made 35 pips profit for last week.
No losses. Third week in a row with zero losses.
Let's see how this week fares.
Wednesday, February 20, 2008
Forex Tools - Alerter Revision 21
Forex Tools 1.0.0 (Revision 21) - Alerter :

Added a new combobox shown in red above. It enables user to select the interval for which to play the sound. Default is 10 seconds. Other options: 15,20,30 and 60 secs. Useful when you are sharing office space and don't want to annoy your colleagues with a sound every 10 seconds.
A non-distracting approach:
1. Lower your volume control
2. Use system sounds (instead of Coin and Cash Register sounds)
3. Select longer interval, eg 30 secs
Monday, February 18, 2008
Why is NY Forex Market closed on a Monday?
My OANDA Widget FXMarket Hours indicated that the New York Forex Market failed to open at 9pm (Feb 18) my country's time (GMT+8) and I wondered why? It should have opened, instead it indicated that it will only open tomorrow night (Feb 19).

I suspect a US Federal holiday perhaps? And so I checked and found this:

It's Washington's Birthday (Feb 18)- a Federal holiday in US.
This is the sort of thing one must watch out for. When a market is closed it will affect liquidity. Low liquidity is bad for Range Traders. The only market now opened is London which is due to close at in about 3 hours time i.e. at 1 am. Then from 1 am to 6 am (Sydney market opens), no market will be opened. This means liquidity will be very low from 1 am to 6 am and I should refrain from opening any positions.
In my country (GMT + 8), the Forex markets opens:
Sydney 6 am
Tokyo 8 am
London 3 pm
NY 9 pm
The period of highest liquidity is when London overlaps with NY, ie. from 9 pm to 12 midnight.
London and NY being the largest and second largest Forex markets respectively.
I recalled that the same thing happened in January 21 - also a Monday. At that time I was also perplexed at NY Forex failure to open. And upon checking, I also discovered that Jan 21 was Martin Luther King Jr's birthday - also a US Federal holiday.
Do not trade Range when spread > peak-to-peak amplitude
Below is an example when you should not enter a Range trade:

Always check the Spread before entering a trade. In the above case, the spread for CHF-JPY is 4 pips - which is larger than the peak-to-peak amplitude of the Bollinger band. It is impossible to profit. In such a case, just be patient and wait for:
1. the Spread to decrease
2. the peak-to-peak amplitude to increase (meaning higher liquidity)
3. the Spread to be < the peak-to-peak amplitude
Saturday, February 16, 2008
47 pips this week no losses
WON: 47 pips
Just using my One-Pip Range Trading Strategy and the Forex Tools - Alerter software, this week turned up yet a winner again with 47 pips and zero losses, beating last week's 36 pips win.
This trading system seems to be working.
Done for the week. It's early Saturday morning - 12.48 a.m. Going to bed....
Will continue trading Morning morning.
Wednesday, February 13, 2008
Breakout always happens after Bollinger Band Compression
The screen shot below shows a compression at point A and followed by a breakout at point B:

I have seen this so many times that I felt it worthwhile to put up a screen shot above.
The astute Range Trader should never put his Limit Orders inside the compressed Bollinger Band. Instead, put it at the previous peak in the amplitude as shown by the small square on bottom right above.

I have seen this so many times that I felt it worthwhile to put up a screen shot above.
The astute Range Trader should never put his Limit Orders inside the compressed Bollinger Band. Instead, put it at the previous peak in the amplitude as shown by the small square on bottom right above.
Forex Tools 1.0.0.20 - OCR Enabled (Automater)
Started a new project - called Project Automater. Below is a screenshot of work-in-progress:

This will be my third addition to the Forex Tools Suite of tools. The first two were:
Stop Loss Calculator
Alerter
Automater can extract numbers, eg, SL, TP, Price, Current, Profits (USD), etc.. from the Oanda FXTrade Window. It does this by using OCR to recognize the numbers from Oanda's Java Application Window. I'm using the free MODI OCR library from Microsoft Office 2007.
Also included is AutoItX library - which is capable of automatically opening any window and clicking or entering text.
At the moment I have not yet come up with any definite use for the numbers extracted from the Oanda Window. Possible applications I can foresee is the ability to automatically do the following:
1. Open/Close Market Orders based on pre-set logic
2. Open/Close Limit Orders based on pre-set logic
3. modify Limit Orders based on pre-set logic
4. modify Stop Losses based on pre-set logic
5. sending SMS or email
6. updating a web page for remote retrieval from cell phones and PDA
7. Oanda Simulation - by storing the price movements for later re-play in a simulator window.
8. Speech synthesis - announcer - for announcing price movements, or, other alerts
I know that Oanda API could possibly do some of the above, but Oanda API does not come cheap, and is surely beyond my means. Hence, this project.
Sunday, February 10, 2008
AutoItX and OCR in C#
Nice references on Using AutoItX in C#
http://dau.shynd.com/forum/index.php?showtopic=955&mode=threaded&pid=12922
Accessing Java Applets using Java Access Bridge
http://java.sun.com/javase/technologies/accessibility/accessbridge/index.jsp#API_calls
OCR capture from Java Applet using MODI
http://www.codeproject.com/KB/office/modi.aspx
Free MODI OCR
http://weblogs.asp.net/jgalloway/archive/2006/10/01/Free-OCR-software_3F00_-You-may-already-have-it_2E002E002E00_.aspx
Misc
http://www.autoitscript.com/forum/index.php?showtopic=52853&st=0
http://www.autoitscript.com/forum/index.php?showtopic=50608
AutoIT Scripting
Learning up AutoIT Scripting Language. Planning to write automated scripts for OANDA later on once I have familiarized myself with this wonderful tool from:
http://www.autoitscript.com/autoit3/
Thanks to this post:
http://www.cyrox.com/forum/index.php?topic=152.0
Now, learning by practising.
Below is an AutoIT script I've written to start Winzip 111 installation and cancel it at the last stage:
Run("winzip111.exe")
WinWaitActive("WinZip® 11.1 Setup","&Setup")
Send("!S")
WinWaitActive("WinZip Setup - WinZip E-Mail Companion")
Send("!N");
Send("{ENTER}")
WinWaitActive("WinZip Setup - Carbonite's Online Backup Service")
Send("!N");
Send("{ENTER}")
WinWaitActive("WinZip 11.1 Setup","Installation Wizard")
Send("!N")
WinWaitActive("WinZip 11.1 Setup","accept the license agreement")
ControlClick("WinZip 11.1 Setup","accept the license agreement",1008)
WinWaitActive("WinZip 11.1 Setup","Installation is not complete")
Send("!E")
Some useful scripts
To call a java app:
Run("cmd.exe");open cmd
WinWaitActive("C:\WINDOWS\system32\cmd.exe");get a focus
Send("cd c:\javaProject {ENTER}");change dir
Send("javac something.java {ENTER}");compile java file
Send("java something {ENTER}");run java class
Send("exit {ENTER}");exit cmd
Other Strategy for java applets:
Get the coordinates of the associated EMBED or OBJECT tag and then click relative to its geometry. See the examples for _IEPropertyGet for a starter.
you can trigger off of pixel colors (PixelGetColor)... _IEPropertyGet will give you coordinates of an object you can use
can access the menus and click on certain points in the window using the mouse co-ordinates or by using Send("!f") {ENTER}
Saturday, February 9, 2008
Newly Revised One-Pip Range Trading Strategy
Below is the newly revised Trading System I am currently using. I have reworded the entire paragraphs:
One-PIP Range Trading Strategy:
1. Look for a Ranging Pair for the Daily Chart and 1-minute Chart eg, CHF-JPY. This system works only for Ranging Pairs, not Trending Pairs. Any pair can become Trending or Ranging, so check with the daily chart to confirm.
2. In the daily chart if the price is in the upper band of the Bollinger bands, this means that the price will change direction by swinging down at anytime. As such, in the 1 min chart, you should enter a short at the inner edge of upper Bollinger band .
3. Enter Limit Orders for 1000 units to make the 1 pip TP's give better yield.
4. In the Limit Order, set TP at a distance of 1-pip from the limit order price.
5. Determine how much risk of loss you are willing to accept and convert it to pips. Then set the SL accordingly. For me, I am willing to risk USD10 loss on every trade and my SL is usually 100 pips away from my limit order price (for the CHF-JPY pair).
6. Ensure that the currency pair is highly volatile and liquid. If the Bollinger band becomes compressed, do not put your Limit Order inside the band, instead put it outside at the point of the upper peak (for Shorts) of the amplitude just before it became compressed. This is because a breakout always happens immediately after a compression. Also, take note of the Spread. A compressed Bollinger band's peak-to-peak Amplitude may be smaller than the spread.
7. Fire up Forex Tools and start the Alerter window. Set the color for the TP line and wait. Ocassionally adjust your Limit Order. Forex Tool-Alerter will alert you when a Limit Order has been fulfilled (via the appearance of a TP line). It will play the sound of a Cash Register, every 10 seconds. Once this happens, there is an opened position. Switch to the 1 hourly chart and bring both TP and SL lines into view.
8. Forex Tool-Alerter will now monitor the TP line. Once the TP (or SL ) line is hit, it will disappear and it will alert you by repeatedly playing the sound of a coin dropping into a coinbox, every 10 seconds.
9. Stop Forex Tool-Alerter and Repeat the process again from Step 1. If the Daily Chart indicates that the price is in the lower Bollinger band, this means that it will start to reverse direction by swinging upwards at anytime. You should then enter a long position in the inner edge of the lower Bollinger band for the 1-minute chart. The rest of the instructions remain the same.
Happy Trading
36 pips profits - Done for the week
WON: >36 pips
Zero losses.
Using the One-pip Range Trading Strategy and with the help of Forex Tool - Alerter, I won at least 36 pips for the week from about 36 trades.
It's late Friday night - nope early Saturday morning.
I'm done for the week - going to bed.
Will resume trading on Monday morning.
Zero losses.
Using the One-pip Range Trading Strategy and with the help of Forex Tool - Alerter, I won at least 36 pips for the week from about 36 trades.
It's late Friday night - nope early Saturday morning.
I'm done for the week - going to bed.
Will resume trading on Monday morning.
Friday, February 8, 2008
Released Forex Tools 1.0.0.19
Screen shot of Revision 19:

Made some changes to the Alerter Form:
1. Changed the coin.wav file because WinXP SP2 does not have codec to play the original coin.wav file. Now, it plays the sound of coin dropping into a coinbox when TP or SL line disappears. Also added System Sounds, i.e. Asterisk and Beep - in case Users wish to have a less distracting and telling sound (eg, when using this program in the office ;-) ).
2. Added a new GroupBox that allows User to preview the Sound Files.
3. Changed color selection algorithm, now User need not wait 3 seconds after pointing mouse in Picture Box. User can just point the mouse at the desired color in the Picture Box and click on it directly. The original algorithm caused a lag on slower machines (Celeron).
I've finally tested it on WinXP SP2. It works like a charm.
Tested on :
Vista (on Intel Core 2 Duo)
Vista (on AMD Turion Dual Core)
WinXP SP2 (on Celeron)
This program is written using Visual Studio 2005 using C#.
Released Forex Tools 1.0.0.16

Released Forex Tools Version 1.0.0.16.
This Revision 16 fixes some bugs on capturing java applet screenshots.
I have also added a new button called Oanda TP Color. This enables me to set the Take Profit color for the Oanda FXTrade Platform without having to Select.
I am quite happy with this software. It has helped me enter more trades - and thus more profits.
So far I have only tested this software on Vista. It should also work on WinXP - just need to install .NET Framework 2.0.
I might put this software up on my website:
http://www.hackingmagic.com
In the meantime, I will continue to harvest pips with it.
Presently my trading Strategy is:
1. Use the One-Pip Range Trading Strategy
(See Jan 31 blog on "The One-Pip Range Trading Strategy")
2. Use my Forex Tools 1 (the Alerter function)
No. 1 above enables me to choose the correct pair and to set the correct Limit Orders
No. 2 above alerts me whenever a Limit Order is fulfilled, or, if an order is already in place, to
alert of a Take Profit (or Stop Loss) hit.
Thursday, February 7, 2008
Completed my Forex Alerter Project

Completed the Forex Alerter Project - after about 2 days of intensive coding. I had actually started the project about 1 month ago. Above is the screen shot. I now use the program to automatically monitor my Stop Loss and Take Profit. All I need to do is select the window which I wish to monitor, in this case, it is the Oanda FxTrade Window. Then, select the Green Line (or Red Line) to monitor Take Profit. Then, click start.
The program will automatically monitor the Green Line and sound a specific sound (a Cash Register sound) every 10 seconds if the line is still present. Once the price hits the Take Profit (or Stop Loss), the Green line (and Red Line) disappears and the Program will then play a different sound (the sound of coins dropping into a moneybag)- to indicate that the Take Profit line is gone.
This way, I don't have to keep watching the monitor. I can either leave the PC on and do other things, or, minimize the Oanda FXTrade window (or send it to background) and do other tasks on my PC.
The program could also be used another way. Set a Limit Order, then click start. Every 10 seconds the program plays the Coin Dropping sound indicating that a Take Profit line has not appeared, meaning the Limit Order has not be fulfilled. Once the price hits the Limit Order price, a Take Profit Line will appear and the program will repeatedly play the cash register sound every 10 seconds.
This program is now in testing. So far it is working quite well.
Friday, February 1, 2008
Using Daily chart to predict M1 chart price movement
WON: 2 pips (1st trade)
WON: 1 pip (2nd trade)
Using One-pip Range Trading Strategy.
Trading the CHF-JPY pair, the daily chart indicates ranging with the price about to swing down from the upper Bollinger Band. This means that I should enter short position:

I then looked at the M1 chart and entered a Limit Sell on the upper Bollinger band.

About 1 minute after that the price hit my Limit Sell and a Short position was opened, and another 6 minutes later, the price hit my TP and I won 2 pips:

I immediately repeated the feat and won another 1 pip.
Have a splitting headache. It's Friday midnight- I'm done for the week. Will resume trading on Monday morning.
The One-pip Range Trading Strategy has made 13 wins this week, totalling 15 pips and seems to be working, whereas using Forex Killer was a tragedy - losing more than -40 pips.
2 Pips win after 23 hours
WON: 2 pips

Used the 1-pip Range Strategy. The daily chart indicates a downward swing. So, in the M1 chart, I shorted the CHF_JPY. The price went up instead and stayed up for 23 hours and finally come down and hit my TP. The strategy works. Price movement will enventually follow the daily range behaviour.

Used the 1-pip Range Strategy. The daily chart indicates a downward swing. So, in the M1 chart, I shorted the CHF_JPY. The price went up instead and stayed up for 23 hours and finally come down and hit my TP. The strategy works. Price movement will enventually follow the daily range behaviour.
CHY-JPY Range Trading Using Bollinger Band
WON: 1 pip (1st trade)
WON: 1 pip (2nd trade)
Successfuly applied the One-pip Range Trading Strategy again and again...

WON: 1 pip (2nd trade)
Successfuly applied the One-pip Range Trading Strategy again and again...

Thursday, January 31, 2008
The One-Pip Range Trading Strategy
This is the Range Trading Strategy discussed in my previous blog:
One-PIP Range Trading Strategy:
1. Look for a Ranging Pair for 1 min Chart
2. Limit Buy or Limit Sell at the inner edge of Bollinger bands.
3. Where possible enter position in direction of Long Term trend, eg short at upper Bollinger band where Long Term is bearish, and long at lower Bollinger band where Long Term is bullish. Long Term could be 1 hour or 1 day chart.
4. Alternatively, if Long Term is also Ranging, eg, if the hourly chart is ranging, then enter position in the direction of the expected price swing. But if it conflicts with the daily chart, give preference to the daily chart. (For this discussion, we assume the daily chart and the hourly chart are in agreement. ) In the hourly chart the price is at upper edge of Bollinger band, then in the 1 min chart, enter a short at the upper Bollinger band as well.
5. Set TP as close as possible to opening price, eg, 1 pip
6. Let SL be Oanda's default which is usually around 10-20 pips
7. Enter 1000 units (instead of the usual 200 or 500) to make the 1 pip give better yield.
8. Ensure that the currency pair is highly volatile and liquid
I shall now illustrate item number 4 above (highlighted in red) with CHF-JPY.
We first look at the daily chart:

The daily chart above shows that the price is at the upper end of the Bollinger band. This means that it should reverse soon and start going down. Therefore, we should not open a long position. Instead any position we open should be a short position.
Next, we look at the hourly chart:

The hourly chart above shows that the price is on the way down. This indicates that the price is still in the upper band of the Bollinger band. As such there is still some posibility that the price will still go down - in order to reach the lower edge of the Bollinger band. This means that we should not open any long positions. Any positions we open should be a short position. Howerver, do note that if there is a conflict between the Daily Chart and the Hourly Chart, you should follow the Daily Chart. Eg, if the daily chart indicates that the price is at upper edge of Bollinger band and is about to swing down, do open a short position. If the Hourly chart shows the price is at bottom of Bollinger band, the Daily chart should be given preference, because it indicates price behaviour in the Long Term.
And finally we come to the 1-minute chart:

You will note that I have inserted a Limit Sell (short position) on the upper edge of the Bollinger Band. I should never put a Limit Buy (long position) because, we have seen that the daily chart as well as the hourly chart indicates the price is going down.
CHF-JPY Range Trade - Bollinger Band
WON: 1 pip (First Trade)
WON: 1 pip (2nd Trade)
WON: 1 pip (3rd Trade)
WON: 1 pip (4th Trade)
I'm back to Range Trading with Bollinger Bands again.
I've mentioned this new Strategy before, but here it is again:
One-PIP Range Trading Strategy:
1. Look for a Ranging Pair for 1 min Chart
2. Limit Buy or Limit Sell at the inner edge of Bollinger bands.
3. Where possible enter position in direction of Long Term trend, eg short at upper Bollinger band where Long Term is bearish, and long at lower Bollinger band where Long Term is bullish. Long Term could be 1 hour or 1 day chart.
4. Alternatively, if Long Term is also Ranging, eg, if the 1 hour chart is ranging, then enter position in the direction of the expected price swing. For example, if hourly chart the price is at upper edge of Bollinger band, then in the 1 min chart, enter a short at the upper Bollinger band as well.
5. Set TP as close as possible to opening price, eg, 1 pip
6. Let SL be Oanda's default which is usually around 10-20 pips
7. Enter 1000 units (instead of the usual 200 or 500) to make the 1 pip give better yield.
8. Ensure that the currency pair is highly volatile and liquid
I applied this strategy to CHF-JPY.
SL=15 pips TP=1

So far so good, I've won 4 times since yesterday, using this strategy. Let's see if it will continue to work.
I entered a second trade with the same currency with the same setup and harvested another 1 pip - 5th win using this setup.
Again, I entered a third setup and again 1 won 1 pip - the 6th win with this setup.
CHY-JPY seems to be very liquid and volatile - time now around 6 pm.
And again - entered another short and won 1 more pip
Total 4 pips within the hour. I' take a break now and continue tonight.
EUR-USD Trend Trading with MACD
WON: 13 pips
4 hours after the Feds announced another interest rate cut on the USD, I entered a 500 units long position on EUR-USD, based on the signal line crossing the MACD in the upward direction with the MACD histogram indicating a strong upward momentum.
SL=23 pips TP=13 pips

After 8 hours, the price hit the TP and i won 13 pips. However, it took 8 hours - strange.
I had expected the EUR-USD pair to rise sharply and steadily. Up to time of writing, it appears the Feds' interest rate cut has very little effect on the EUR-USD pair. There was an initial sharp rise (see the blue long bar above). After that, it was ranging sideways. I opened a long position indicated by the blue triangle.
CAD-JPY Range Trading using Bollinger Bands
WON: 1 pip

Won: 1 pip
New Strategy:
1. Look for a Ranging Pair for 1 min Chart
2. Limit Buy or Limit Sell at the edge of Bollinger band.
3. Set TP as close as possible to opening price
4. Let SL be Oanda's default which is usually around 10-20 pips
The profit is only 1 pip, but if you did it 10 times, you get 10 pips. The last 3 trades were all done within the hour harvesting 3 pips profits.
It's 12.28 am. Yawn.... Going to bed.

Wednesday, January 30, 2008

EUR-CHF Trading the Daily Chart - without Forex Killer
WON: 1 pip
I have had enough losses using Forex Killer 1 and 2 and have lost all confidence in them. In all the previous trades using them, I only won 1 trade and lost all the other 4.
From now on, I think I will stick to Bollinger Band for Range Trading and MACD for Trend Trading - the two classical tools for Range and Trend Trading respectively. My strategy is also to trade the Daily Charts - since this chart is indicative of Long Term price direction.
Below is my first experiment with Daily Charts, trading the EUR-CHF pair:

SL = 27 pips TP= 24 pips (Oanda's default)
Decision to open long trade on EUR-CHF is based on:
1. MACD trigger line crossing MACD in upward direction
2. MACD Histogram indicates strong upward momentum
Only 200 units - just to see what happens. Will MACD work better on Daily Charts? So far MACD has not been reliable on short term charts: M1,M5,M15,M30.
I avoid the USD currency for today because I do not know how the second US interest rate cuts (due to be announced today - Jan 30), will impact the USD.
Re-adjusted my SL=50 pips and TP=100 pips
Throughout the whole day the price moved down and up and stayed at around the same price. Looking at the 1 minute chart, I saw many range bound trades - which I had missed out on. Realizing this, I immediately closed the position with a 1 pip profit. It was evident the price was going nowhere.
Tuesday, January 29, 2008
EUR_CAD using Forex Killer 1
LOST: -40 pips

Short EUR-CAD, SL=40 pips, TP=20 pips :

After 3 hours, the price rose and took out my Stop Loss. I lost 40 pips.
Forex Killer has failed yet again. I am beginning to lose confidence in Forex Killer.

Short EUR-CAD, SL=40 pips, TP=20 pips :

After 3 hours, the price rose and took out my Stop Loss. I lost 40 pips.
Forex Killer has failed yet again. I am beginning to lose confidence in Forex Killer.
CAD-JPY using Forex Killer Version 1
LOST: -40 pips

500 Units Long SL=40 TP=80 :

The price went up a few pips then rapidly dropped and took out my Stop Loss.
I lost 40 pips. Forex Killer has failed.
In retrospect, this might have worked: SL=40 TP=10
Most of the price will move up 10 pips quite easily but to reach beyond that is very difficult.

500 Units Long SL=40 TP=80 :

The price went up a few pips then rapidly dropped and took out my Stop Loss.
I lost 40 pips. Forex Killer has failed.
In retrospect, this might have worked: SL=40 TP=10
Most of the price will move up 10 pips quite easily but to reach beyond that is very difficult.
Forex Killer version 1 is better than version 2?
Input the 10 previous price on the hourly chart of GBP-USD, I get two different signals, depending on which version of Forex Killer. Below is version 2, which gives a Sell signal, with probability of 62%:
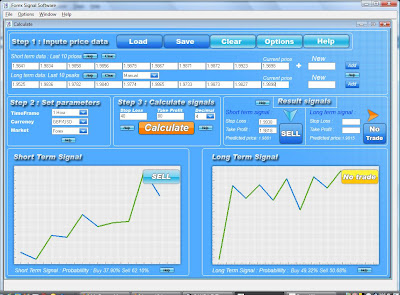
What is perplexing is why does it give a SELL signal when the graph clearly shows a long-term uptrending? It is only in the last price that is going down. How can this justify a SELL signal at 62%?
Next, I repeated the exercise using version 1. And this is what I got:

Notice that it is much easier to input price values in version 1. Firstly, I can just type 4 digits (and 3 digits in the case of JPY). I don't have to type in 1.9841, it is sufficient to just type in 9841. When I did this in version 2, I get a strange flatline. Secondly, in version 1, after entering a price, and pressing Enter, the input box clears by itself and I can enter the next price. But in version 2, I had to use to the mouse to use the mouse to click in the text box first, after each Enter key - this slows input down quite a lot. But the most starling thing is it gives a NO TRADE signal even though the Sell probability is 69%.
However, version 2 has the added Long Term Signal analysis which says NO TRADE. That alone could indicate a No Trade, if we only wish to enter a trade when both ST and LT agrees.
A possible trading strategy, which is highly conservative would be as follows:
SELL when both ST and LT indicates a Sell Signal AND,
the probability for the ST is 70% or above (as is the case with version 1).
BUY when both ST and LT indicates a Buy Signal AND,
the probability for the ST is 70% or above (as is the case with version 1).
Having said that, I still have a nagging feeling that Version 1 is a better signal indicator - for the reasons discussed above.
USD-CAD using ST and LT Signals
LOST: -24 pips
Strategy: When Both ST and LT Signals say the same thing, enter the trade:

Entered a Long Position for 1000 units for USD-CAD pair, SL=19 pips, TP=16 pips at 11:30 am.

Let's see if Forex Killer v.2 is any good.
After 4 hours, I was stopped out for -24 pips. Looks like Forex Killer v 2 was totally wrong about this trade despite it's ST and LT signals.
First Trade for Today GBP-USD
LOST: - 3 pips
Forex Killer Sell Signal generated on GBP-USD pair at 10:20 am:

Notice I'm using Forex Killer v 2.14. Yesterday, I was using v 1.0. Also notice that a Sell Signal is generated even though the Sell Probability is only 55%. With v 1.0, you only get a Sell Signal is it is above 70%. I hope v 2.14 knows what it is doing.
I entered a short position for 1000 units on GBP-USD for 1.9821, SL=34 pips, TP=30 pips

I then did a Long Term Signal Analysis and came up with a No Trade Signal:

Notice that the Short Term Signal ("ST Signal") indicates SELL, but, the Long Term Signal ("LT Signal") indicates No Trade. I immediately closed my open position with a loss of only 3 pips. In all my next experiments, to make the trade prediction stronger, I will only enter into a position if BOTH the Short Tem Signal and the Long Term Signal indicate the same signal.
Monday, January 28, 2008
Second EUR-USD Trade today using Forex Killer
WON = 30 pips
LOST = -9 pips
Again, I got another buy signal on Forex Killer:

I entered a long position with SL = 40 pips and TP = 20 pips at 9.15 pm :

After 1 hour, the price went up 12 pips and I re-adjusted my TP to 80 pips.
In the next hour, the price went up 30 pips from my entry price. It then started to go down. I immediately adjusted my SL 10 pips above my entry price to lock in 10 pips profit. Note that Oanda Trading Platform has no Trailing Stops.
When the price rose 45 pips, I entered another long position of 500 units at 1.4794 SL = -40 pips TP=80 pips
I now have 1000 units opened.
In the next hour, the price begin to drop 7 pips. I increased my SL = 20 pips above the entry price for the first long position. This locks in 20 pip profits. The next hour in increased SL = 30 pips to lock in 30 pips profit and also closed my 2nd trade with a loss of 9 pips. I now have only 1 open position with SL=30 pips above entry price and TP=80 above entry price
After 2 hours, the price dropped and I was stopped out, winning 30 pips.
Forex Trading Using Forex Killer on EUR-USD
WON: 12 Pips
Got buy signal:
Entered long at5.20 pm. SL = 40 pips, TP = 22 pips

The price went about 15 pips then reverse down, whereupon, I closed the position and
Won 12 pips:

This time Forex Killer was correct in its prediction.
Got buy signal:

Entered long at5.20 pm. SL = 40 pips, TP = 22 pips

The price went about 15 pips then reverse down, whereupon, I closed the position and
Won 12 pips:

This time Forex Killer was correct in its prediction.
Forex Trading using Forex Killer on USD-JPY
LOST: 40 pips
In the previous trading, the price took out my adjusted Stop Loss. I re-ran Forex Killer again and this time it gave a 92% sell signal for the H1 chart:

And so, I shorted the USD-JYP again at 106.15 at 3.15 pm:

I then adjusted the SL to 40 pips, i.e at 106.55 and left the TP for 16 pips at 105.99.
Ater about 15 minutes, the price rose 40 pips and took out my Stop Loss. I had lost 40 pips.
Forex Killer seems to be wrong on this trade.
Forex Trading Using Forex Killer
Experimenting with Forex Killer.
Based on this: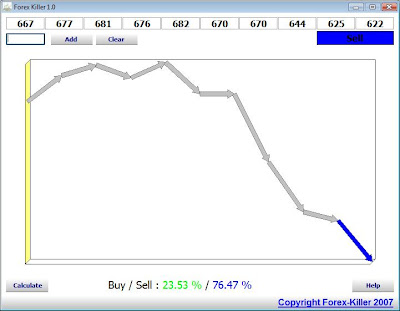
Note that I used only 3 digits. For example, instead of typing in 106.67, I just typed in 667.
For JYP, one pip is .01, so Forex Killer should still work.
I shorted the USD-JPY at 106.19 at 1.08 pm. Below is the screenshot after 1 hour:

I had moved my Stop Loss from 40 pips to the Actual Sell Price itself. And I moved the Take Profit 60 away. Hopefully the profits will keep running. ForexKiller has been correct so far.
Unfortunately after about 5 minutes, the price went up and took out my Stop Loss and I made 0 pips profit. It appears that I have tried to lock in the profits too soon.
Based on this:

Note that I used only 3 digits. For example, instead of typing in 106.67, I just typed in 667.
For JYP, one pip is .01, so Forex Killer should still work.
I shorted the USD-JPY at 106.19 at 1.08 pm. Below is the screenshot after 1 hour:

I had moved my Stop Loss from 40 pips to the Actual Sell Price itself. And I moved the Take Profit 60 away. Hopefully the profits will keep running. ForexKiller has been correct so far.
Unfortunately after about 5 minutes, the price went up and took out my Stop Loss and I made 0 pips profit. It appears that I have tried to lock in the profits too soon.
Saturday, January 26, 2008
Forex Range Trading inevitably involves Trend Trading
Here are my observations to date:
When trading Range Trading, I am looking at a short term period, usually 1 min to 15 mins charts.
Should I then, short at the top of Bollinger band or long at the bottom of Bollinger band?
To answer this, I should take a look at the larger period charts, eg, 1 hour or 1 day- to find the larger trend. If the hourly (or daily) chart shows a bullish trend, then, I should enter long at the bottom of the Bollinger band - NEVER short at the top of Bollinger band. Why?
Because there is an inertia for the price to go up. If the price were to break from the range channel, there is a tendency for it to go up.
The reverse is also true. Let's take a reverse scenario. Let's assume the price is now ranging when I look at the 15 min charts. Should I short at the top of Bollinger Band, or, long at the bottom of Bollinger band? To answer this, I would look at the hourly (or daily) chart. If I find that the hourly (or daily) chart indicates a bearish trend. Then, I would short at the top of the Bollinger band - NEVER long at the bottom of the Bollinger band. Why?
Because there is an inertia for the price to go down. If the price were to break out of the range, there is a high probability it will go down.
What about Stop Losses, where should I put them?
First determine how much USD you are willing to risk, if you are willing to risk USD10, then convert it to pips, eg, 100 pips, and put your stop 100 pips below your long position, or, conversely 100 pips above your short positions.
Also, always enter a position when it is ranging - never when it is trending. By the time you spot a strong trend, it is usually too late to join the trend - this is because, you will never be able to spot a trend and join early. A trend, by definition, is a trend when there is already a clearly upward price movement or vice versa - by then, the trend is at risk of exhaustion. Instead, wait for it to consolidate (range), then enter a position in the direction of the trend as described in the above paragraphs.
In, Oanda Trading Platform, to convert price to pips. Look at the Account Summary Window on the left. Take the Unrealized P & L value and divide that with the value shown in the Profit Pips box on the top right. That will give you the price/pip. Then assuming you are willing to risk USD10 for Stop Loss, take 10/(price/pip).
I have also found MACD and Momentum Histogram to be unrealiable. Even though the trigger cuts the MACD and indicates a signal - the same trigger can almost immediate cut the MACD line again in the opposite direction! Be careful. The MACD histogram is equally unreliable. Even though the histogram may show a momentum exhaustion - indicating a price reversal, yet, int he next instant the momentum histogram may quite unexpectedly pick up again! Be forewarned.
Also, Stop Losses should never be tight. You should put large stop losses and trade very small units. Tight Stop Losses will knock you out probably 8 out of 10 trades! But in my experience, putting large Stop Losses will knock you out 2 out of 10 . Again be careful. That 2 out of 10 loss may be huge because of the large Stop Losses!
Other psychological observations:
1. Once a position is entered, don't bother to watch the monitor. Only check it at regular intervals. Impatience is the enemy. Watching a price going the wrong direction may cause you to close the position prematurely before it has a chance to turn around. Or, conversely, you may take profit too early and lose out on potentially larger earnings.
2. Never take revenge by entering an opposite direction once you lost a trade. By then the trend is almost always nearing exhaustion. Remember, the price has already travelled a long distance to hit your large Stop Loss.
Friday, January 18, 2008
Forex Range Trading CHF-JPY Pair

Using Bollinger Band. Selling at the top of the band and buying at the bottom of the Band.
Thursday, January 17, 2008
Large Stops and Waiting for Infinity....
Since I wrote my last observations about having large Stop Losses, I have experience the following:
1. If I trade very small units, I can set very large stop losses.
2. However, the profit that I will make is also very small (a few cents).
3. I might have to wait for days while the gap climbs to 10 pips, 20, 30, 40.... 100 pips and then,
ranges for eternity at 100 pips away, whilst I wait miserably with nothing to do.
4. It might be better to carefully select the currency pair that is ranging, and put tight stops.
If I'm wrong, I don't want to wait forever... I prefer to be stopped out early so that I can
use my capital to enter another position.
5. Alternatively, If I can't find a nicely ranging Currency Pair, I can trade Trend (instead of
Range). To trade trend, I would switch to MACD. When the trigger crosses the MACD
in the upward direction, I would buy (long position). When the trigger crosses the MACD
in the downward direction, I would sell (short position). I would put very tight stops. I also
want to be out early if I am wrong.
Friday, January 11, 2008
Successfully Range Trading USD-JPY Pair
Snapshot of a trading session using Oanda FxTrade Forex Trading Platform:
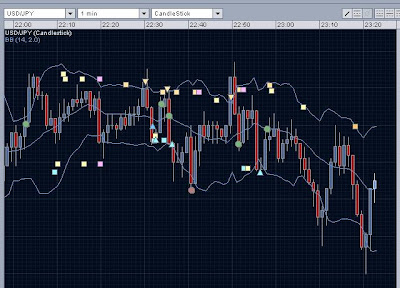
Selling at the top of the Bollinger Band and Buying at the Bottom of the Bollinger Band. A profitable range-trading strategy.

Selling at the top of the Bollinger Band and Buying at the Bottom of the Bollinger Band. A profitable range-trading strategy.
Subscribe to:
Posts (Atom)
